Asset Tracking & Management: An IoT Strategic Imperative

One of the most compelling use cases in IoT is in the area of Asset Tracking and Management. Asset classes can range from living, nonliving, transitory, stationary, remote to the accessible. An Asset Tracking system designed for one asset class can rarely be redeployed for another asset class as is. Each of the use cases and application scenarios are different and unique.

A further challenge to the emergence of a single dominant platform for managing assets is the heterogenous nature of assets that firms typically employ, even within the same industry. Therein lies the challenge of developing an Asset Tracking system; necessitating a multifaceted approach across various disciplines.

Wastage in Businesses – Inefficiency or Cost of Doing Business?

Every year businesses across all sectors of the economy lose billions of dollars on account of the following:

  1. Excess Inventory on hand.
  2. Low Asset Utilization and/or Asset Loss.
  3. Non-identifiable, Non-trackable and Perishable supplies.
  4. Labor costs associated with idling and/or unnecessary hauling of equipment.
  5. Line stoppages and business interruptions due to missing supplies and/or equipment breakdown.
  6. Cost of expediated transportation.

The above challenges need a systemic approach to tackle the inefficiencies, but you can’t fix what you don’t know.

Asset Tracking System: A Strategic Imperative

Activist investors are pressuring mismanaged firms to undertake a strategic review of how their businesses are run. During the 2017 proxy season, activists launched 327 public campaigns against U.S. companies, with $121 Billion1 under their management. Firms needs to proactively identify areas of weakness in their sphere of activities and call for a course correction.

Here are a few examples where the use of Asset tracking can unleash hidden value, eliminate waste and increase overall efficiency:

  1. In Los Angeles and Long Beach, California home to the busiest container ports in the USA, average truck turn time is around 82 minutes.2
  2. According to a 2017 study by National Retail Federation U.S. businesses lose around $50 billion annually to retail shrinkage.3
  3. Transportation delays in-transit and on customer premises will cost US chemical manufacturers an additional $22 billion in working capital on account of additional inventory held.4
  4. Annually hospitals lose 20% of their equipment. Historically asset utilization in US Hospitals has stayed around 40 percent, which means valuable assets such as IV pumps sit idle 60 percent of the time.5
  5. In the USA, an average city water utility loses 30 percent of the water supplied through leaks or un-billed usage.6

Asset Tracking System: A Competitive Advantage

The Internet has played an important role in the creation of new products-ideas, their diffusion and in levelling the playing field across firms and industries. Gone are the days where quality management systems such as TQM and Six Sigma enabled firms to leap frog competition.

The basis for competition in the hyperconverged world relies on achieving better quality with greater agility, easier provisioning and lower administrative costs. It’s imperative for firms to adopt a system wide view of their activities from procurement, design, manufacturing, operations, delivery, installation to use.

A firm that can leverage enterprise knowledge, integrate best practices and leverage asset tracking data can acquire a competitive advantage over its rival. To get there, firms need to invest on a platform that can leverage multiple data points and in-house knowledge to unlock hidden value.

Asset Tracking: Passive, Active or Intelligent?

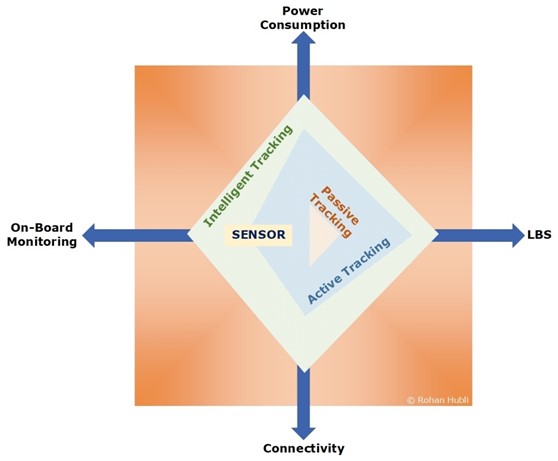
At the basic level passive asset tracking involves nothing more than an electronic label and reader (e.g. RFID, NFC). One level higher is Active Tacking which entails connectivity, LBS (Location Based Services) and some form of a sensor coupled to a power source.

An intelligent asset tracking solution adds an extra layer of complexity with On-Board Monitoring, of one or more parameters of interest. Applications that require Real-Time resolution can now handle extreme events and undertake preventative actions.

Asset Tracking and Management – The Six Critical Elements

A compelling Asset Tracking solution requires the delicate act of balancing six critical elements – Sensors, Location Based Services (LBS), Connectivity, Power Consumption, On-Board Monitoring and Analytics.

  1. Sensors: The one analogy that I can think of when it comes to sensors is blood. Like blood, sensors serve three main functions: convey, protect and regulate the asset under observation. Sensors comes in all shapes, forms and functions the choice depends on what one intends to monitor, control and prevent.
  2. Location Based Services (LBS): For assets confined within a certain geographic radius (e.g. hospitals, warehouses, factory floor) one can assign fixed location identifiers or use triangulation (aided by beacons) to pinpoint location. If the asset under consideration involves a moving target (e.g. trucks, drones, mining equipment, shipping containers) that requires real-time monitoring one can select GPS or A-GPS (lower battery drain).
  3. Connectivity: The choice of connectivity often boils down to the tracker location (local vs. remote) and mobility (stationary vs. transitory) constraints. Additional requirements stem from network reach and coverage – PAN, LAN, MAN or WAN. The choice for a reliable connection range from NFC, Bluetooth Low Energy (BLE), ZigBee, ZigBee-IP, IEEE 802.11ah, WLAN to LPWAN (SigFox, LoRa, RPMA, Symphony Link, Weightless, NB-IoT, LTE-M). To offset some of the limitations arising out of cost, security and low power consumption gateway devices are often deployed for last-mile connectivity.
  4. Power Consumption: One of the key design metric in deploying trackers is whether to be battery or grid powered. For remote or unreachable applications, the choice is often forced. Additional constraints that dictate power usage include -Always ON, Alive When Spoken To and Periodic Awake.
  5. OnBoard Monitoring: Applications that demand real-time monitoring have an additional constraint: take preventative or corrective actions before it’s too late. In battery powered devices there is a critical requirement to eliminate redundant data transfers or aggregate sensor readings. Both these scenarios call for an On-Board monitoring system.
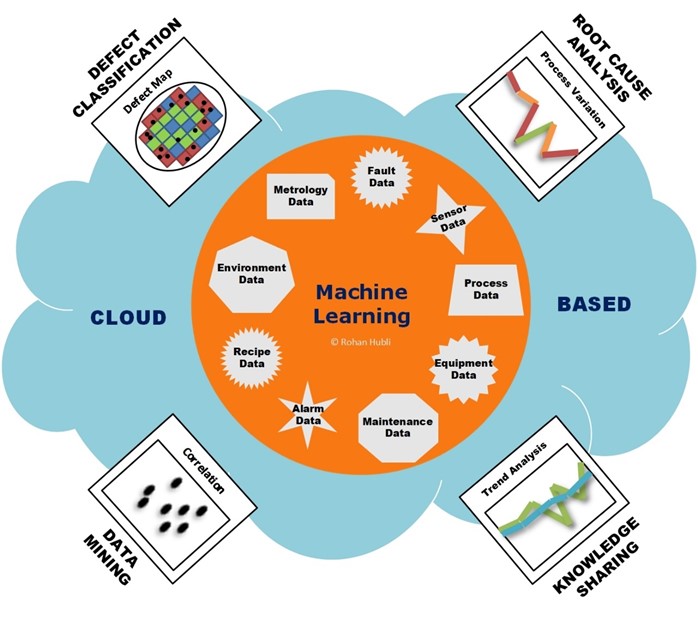
  6. Analytics: What good is any data if you can’t act on it. The real value in any asset tracking system is knowing how to develop real-world solutions based on the insights gathered. The applications are numerous but just to list a few – Overall Equipment Efficiency, Defect Monitoring & Classification, Predictive & Preventative Maintenance, Trend Analysis and the holy grail using Machine Learning and AI to uncover hidden value.

A follow-on post will look at how various technologies can be leveraged and integrated to build a solution from ground up, specifically for the trucking industry.

References:

  1. The 2017 Proxy Season, Published by J.P. Morgan’s M&A Team, July 2017
  2. Average Monthly Truck Turn Time, Harbor Trucking Association, 2015-2017
  3. National Retail Security Survey 2017, NRF
  4. Transporting growth: Delivering a Chemical Manufacturing Renaissance, American Chemistry Council, March 2017
  5. Industry Survey: Transformative Technology Adoption and Attitudes—Location Technologies, ABI Research, 2Q 2017
  6. Smart Water Network, Navigant Research, 2016
  7. Prince, Jeffrey and Simon, Daniel H., Has the Internet Accelerated the Diffusion of New Products? (April 1, 2009).

Acknowledgements:

In fond memory of Rev Fr. Agnelo Pinto and Rev Fr. Pat D’Lima whose guidance during my adolescent years at St Paul’s High was instrumental in shaping who I am today.

The Future of Semiconductor Business & Innovation

Abstract: The Life Cycle theory on industry evolution suggests that the rate of knowledge obsolescence tends to diminish over time. In effect it deters new entrants from entering the industry; the ensuing shakeout forces industry consolidation and concentration. The fallout; operational efficiency, product proliferation and price discipline take center stage.

In the semiconductor industry the very presence of technological knowledge obsolescence has prevented industry shakeout and consolidation up until now. However, with escalating costs and the fundamental limits on device physics reaching a climax are the curtains descending on the semiconductor industry. If so, what are the ramifications for the industry and its ecosystem?


Downloads:

  1. Future of Semiconductor Business & Innovation
  2. Fabless Semiconductor Chip Startup Business Plan
  3. Semiconductor SOC Design Cost Model

First a brief look at the semiconductor industry dynamics:

1. Semiconductor fabrication plants exhibit exponential cost dynamics. Rock’s Law, named after the visionary venture capitalist Arthur Rock, predicts that the cost of a semiconductor fab will double every four years.

2. Semiconductor Industry is characterized as having very high fixed cost, and low variable costs.

3. A cutting edge semiconductor fab has an active life cycle that lasts anywhere between three and five years. The cyclical nature of the industry results in periods of high capital expenditure interspersed with bursts of revenue streams.

4. Moore’s Law, named after the visionary cofounder Gordon More of Intel, predicts that the size of a semiconductor chip will shrink by half every two years (everything else remaining the same).

5. Semiconductor chips although very design intensive benefit heavily from division of labor.

6. Semiconductor design exhibits compelling scope economies due to cumulative experience and design knowledge.

7. Semiconductor design is susceptible to significant knowledge obsolescence within domains.

8. Process and Product Innovation both happen at the same time. Firms either acting alone or together orchestrate process innovations that the entire industry draws upon. Product innovations on the other hand are firm specific.

9. The industry is highly competitive with low barriers to entry. However tacit knowledge and market reputation favor both scope and scale economies.

Semiconductor Value Chain and State of the Industry

As of 2011, worldwide semiconductor sales attributed to IC’s and components reached $299.5 Billion. The market is fragmented across all sectors except in the area of microprocessors were a duopoly exists. The worldwide pure play semiconductor foundry market totaled $29.8 billion in 2011. The top five foundry players accounted for almost 80 percent of the foundry market share.

clip_image002

Electronic Design Automation (EDA) vendors accounted for revenues of $4.19 Billion in 2011. Semiconductor chip design, verification and implementation tools accounted for almost 90% of this market, with the rest owned by PCB design tools.

The market for semiconductor IP registered sales of $1.58 Billion. Design Services made up another $350 Million in revenue for 2011. IC Packaging and Assembly generated revenues of $13.9 Billion and the embedded software market registered sales of $1.2 Billion. Semiconductor FAB’s demonstrated revenues of $29.8 Billion in 2011.

Across the value chain semiconductor chip companies and semiconductor FABs account for the lion share of the revenue. The former exploits economies of scope and the latter economies of scale.

Revenue Drivers

SemiconductorMarketSize(2011)

Cost & Value Migration

An amalgamation of processor cores, feature rich IP and fab for hire have pushed the value frontier to a new normal. Aided by quantum jumps in feature size and design productivity, SOCs redefined products and markets.

The first generation of SOC’s saw processor, peripherals, interfaces and memory integrated. The second generation of SOC’s built on the previous by harnessing multiple cores, RF and power management functions. The third generation of SOC’s will bring together photonics, high density memory and MEMS into the main stream.

CostPerformanceRatioCost Performance Ratio, SOC’s – The New Normal

On the value frontier, a leading edge System-on-Chip (SOC) offers cost-performance ratio that rivals the elite microprocessors of today. The new players with vastly different business models are increasingly threatening the old guard. However both have seen semiconductor design costs reach epic proportions.

With increasing levels of integration and multicore processors becoming the norm, hardware and software costs have exploded. Verification engineers and software developers now covet over half of the development team. As geometries shrink, tooling efforts to account for increasing variability of parameters and DFM (Design for Manufacturing) requirements have further exacerbated the problem.

The Economics of Chip Design

A typical semiconductor company spends anywhere from 20% to 25% of its revenue on R&D with COGS accounting for another 40%-45% and SG&A in the region of 10% – 15%. With these assumptions and using the Semiconductor Chip Design Cost Model the numbers that emerge tend to favor products that can be milked over relatively large periods of time or in markets with large demand side economics of scale.

SOCCostVolumeRatio

To put things in perspective, the annual shipments of microprocessors (all segments) in 2011 stood at 350 Million units. High-end smartphone shipments reached 60 million units in 2011. The returns necessary to justify investment on a new chip requires double digit market share.

Fabless Semiconductor Startup:

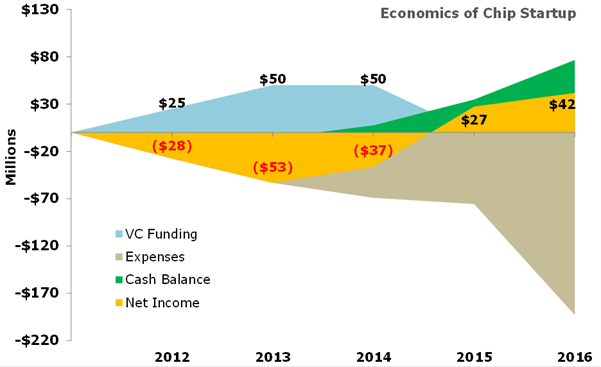
The picture is no different for emerging startups wanting to unleash the next biggest idea or invention. Although startups rely on VC money to fuel R&D in the initial stages the return necessary to justify venture investment are increasingly out of reach for many.

A semiconductor startup pursuing an opportunity in a fast growing market needs to capture more than 10% market share and demonstrate higher probability of success. To deliver both, the odds are as good as winning the lottery. (See: Fabless Chip Startup Business Plan)

clip_image006

Startup Exit Valuation:

EconomicsofFablessSemiconductorStartup

Note: Startup is funded, based and operates solely out of USA

Implications for Product Innovation

It is imperative for designers to leverage legacy designs, in die form, surround them with abundant memory and unleash rich software to create value. New alternatives in 2.5D packaging (side-by-side die on an interposer) or 3D packaging (Through-silicon-Vias) will aid this effort. Many low to medium volume applications will make this transition. OEM’s in commodity markets will increasingly adopt COTS and rely on ODMs/EMS to bring solutions. Software will be the basis for differentiation.

For high volume applications the next wave of innovation will require products that can integrate wider range of heterogeneous functions (mobility, sensing, intelligence, adaptability and connectivity).

ChipofTomorrow

The market will essentially evolve to provide one or all of the following functions- Intelligence, Connectivity, Stimuli and Gratification in varying degrees. A chip that can integrate all of the above functions and satisfy the needs (price/performance) of the market will unleash major realignment and shakeout within the industry.

Imagine a TV in the not so distant future that morphs into a Gaming Console, a PC, a Web-TV or an entertainment hub based on the need. Embedded Hardware Virtualization will make this happen and enter mainstream market in a big way.

Intelligent Devices constitutes another market area with a potential volume larger than PCs, Mobile Phones, Servers, and Tablets combined. With a 2020 vision of 25 Billion devices the market requires Sensing, LBS, Augmented Reality, Analytics, Security and Self-Monitoring to be prevalent in most nodes. A platform centric vision for intelligent nodes can unleash innovation and propel existing players to new heights.

We are entering a realm of devices capable of features analogous to what we humans are born with. Ironically most humans share the same feature set. It is the DNA that confers uniqueness and character. For chips, with similar features, software will emerge as the key differentiator and enabler that can morph into something unique depending on the context.

The Road Ahead

Globally the aging population (65+) will grow to 2 Billion by 2050. The world’s emerging middle class will reach 4.9 Billion by 2030. Developed and emerging economies share of the middle class will reverse from the current 50% to 22%. A slow-cycle market characterizes one and a fast-cycle market exemplifies the other. The challenge lies in managing both at the same time and within the same organization.

1. Industry Concentration: The minimum efficient scale (MES) for a semiconductor fab is nearing $10 Billion. For a fabless chip company the ratio of minimum sales volume (MSV) to market size has reached double digits (~15%). As platform products and services, with winner-take-all dynamics, become more prevalent, the industry will consolidate. Firms either need to pursue broad line differentiation or risk being caught in the middle where the future is anything but certain. Each market vertical will converge to the “Rule of Three” with an uptick in M&A based on horizontal product line reach.

2. New Business Models: The new winners will be those who can enrich customer captivity (combination of switching and search costs) and combine it with supply side economies of scope. The industry will favor fast-followers and late adopters over innovators. An asset lite model supplemented by just-in-time design methodology and standardized hardware platform with software differentiation will redefine competition.

3. Vertical Integration: OEM’s will be forced to ensure that their semiconductor suppliers remain viable and continue to create value. Some form of vertical integration either in the form of minority stake, multi-year supplier partnership or outright purchase will become a necessity. Pure play foundries and EDA specialists will integrate forward to offer one stop R&D solutions by assembling a portfolio of IP’s and engineering resources. At the technology level high density Memory (3D), MEMS, Interconnects, Photonics and Embedded Software are prime targets for M&A.

4. Operational Efficiency: Ultimately all firms needs to generate returns that cover the cost of capital. The less efficient companies will struggle merely to remain afloat. Efficiency governs all activities from engineering, production, marketing, sales, to operations. The organizational power structure, long the bastion of engineering, will cede control to marketing and finance.  ROIC the new mantra.

5. R&D: Escalating costs, will force many chip companies to offshore R&D. In the next five years leading edge designs, the stronghold of Silicon Valley will move overseas as markets there become large. Many companies will transform their model to one of an IP provider. Foundries, the current gateway for all semiconductor chips will move up the value chain to offer one stop solutions as will EDA companies. Development of process technology for new nodes will require pooling of industry resources together.

6. Value Migration: For firms to generate economic profit it is imperative to adopt a software centric vision for the products as value migrates from hardware to software. Firms that can package and deliver hardware-software together will remain immune to commoditization and reap the benefits of lock-in and network effects. If you are somehow not plugged into one of the platforms, competition will force you out.


Closing Remarks:

As the economics of semiconductor business undergoes fundamental shift, changes in the value chain and ecosystem is inevitable. To sustain economic profits exploiting economies of scope in R&D resources will become critical and challenging. One business model that could disrupt the industry is “Just in Time Design” harnessing elements from Dell’s supply chain model and Toyota’s production management system. When transaction and search costs associated with semiconductor Intellectual Property and Engineering Talent intersect on an EBay like trading platform the vision will become a reality.


References:

  1. Semiconductor Annual Revenue Data sourced from WSTS, April 2012
  2. EDA Annual Revenue Data sourced from EDA Consortium MSS Newsletter, Q1-Q4 2011
  3. Semiconductor Foundry Market Data sourced from Gartner, March 2012
  4. Processor Market Shipments by Industry and Architecture, IDC, February 2012
  5. Semiconductor Industry Profitability Analysis based on financials from 2007 – 2011 of Top 10 players in each category excluding outliers. Data compiled from Annual reports, Morningstar, Bloomberg and SEC filings.
  6. 2011 PC Shipment Data, Gartner, January 2012
  7. 2011 High End Smartphone Shipment Data, Berg Insight, February 2012
  8. Intelligent Systems, The Next Big Opportunity, IDC, August 2011
  9. World Population Aging, United Nations
  10. World’s Emerging Middle Class, sourced from Dr. Homi Kharas, The Brookings Institution,
  11. Global Semiconductor Alliance, March 2012
  12. EDA Consortium, Quarterly Marketing Statistics (2011). Market Research Reports
  13. ChipSTAT Annual Review, April 2011
  14. NASSCOM, Opportunities in Embedded Software (2010)

Acknowledgments:

To my colleagues and peers in the semiconductor industry with whom I have shared and enjoyed an incredible journey. Your inputs on the Survey are highly appreciated. Thank You for taking the time to answer it.


Platform Products & Services: A Strategic Guide to launch, sustain and build enduring leadership

 Article at a glance: A new breed of companies has emerged on the scène that only seem to get bigger and bigger with each passing day. The companies ranging from Cisco, Intel, Microsoft, Google, EBay, Facebook, Netflix, IBM, Alibaba to Apple have one thing in common their ability to develop platform based products and services. What gives platforms the edge and what strategies can one deploy to successfully develop platform based products or service.  ( Download PDF )

A follow on article will analyze how the Android Platform has emerged from nowhere to dominate the market for Smartphones and eventually take over everything from thin-clients, cloud computing, consumer electronics and ultra mobile internet devices market.

Introduction: Why Platforms?

The relentless pursuit of globalization with diminishing borders, instant dissemination of information, ubiquitous use of information technology and swift diffusion of ideas have heralded two important changes to the competitive dynamics of companies:

  1. Imitation of new products and services at an alarming rate.
  2. Traditional sources of competitive advantage no longer guarantee sustained leadership.

Given the state of hyper-competition it is no wonder that product lifecycles are shrinking and new competitors are emerging from nowhere to erode market share and with it revenue streams.

A company with a blockbuster product has to innovate at a rapid rate just to stay ahead of competition, a feat easier said than done. The safest bet it seemed was to add “Branding” or “Service” dimension to the product mix; intangibles that are harder to replicate. But even here the advent of ERP software, CRM systems, internet advertising and diffusion of best practices are bringing competitors and products closer than ever before.

On the other hand, a different breed of companies armed with platform based products/services seem invincible; immune from commoditization of products and services with a customer base that is deeply entrenched and group loyal.

Platforms: A platform by definition is a place (physical or virtual) where mutually interdependent players (single or multiple) conduct transactions, avail services, fulfill needs or realize an experience. An important distinction regarding platform centric products and services is their “self-reinforcing character” i.e. a core product or service whose value (benefits conferred) increases as more and more people adopt it.

A common characteristic of most platform based product or services is a participation fee and the recurring revenue streams (perpetual) generated by selling complementary products or services.

Examples: EBay, PayPal, DVD Players, Personal Computers, Google, Apple-iTunes, NTT-DOCOMO, Alibaba.
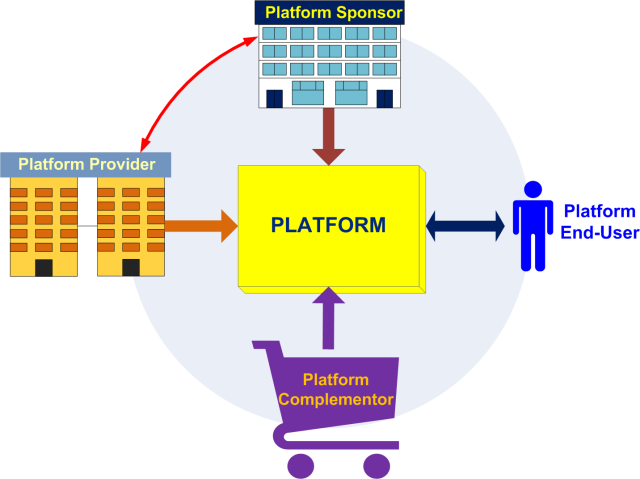
Platform

Platforms Everywhere:

Look around you and an increasing number of products sold today are networked in some way or the other. EBay connects buyers and sellers on a virtual platform. Gaming consoles connect players with video game publishers and other players. DVD players and Televisions systems now offer an endless number of choices to provision, access and personalize content. Apple connects content producers and application software providers with end users. Google connects internet users with web sites and web portals. MasterCard, Visa and PayPal connect buyers, sellers and intermediaries with each other. Intel and Microsoft connect PC users to application software providers and other PC users. The list goes on.

What’s common to all of these players is their ability to bring together interdependent players in a way that creates value for everyone involved.

Note:

1. A key distinction between platform based products/services and internet Ecommerce sites (Ex: Priceline, E*TRADE, Amazon) is the fact that the latter restrict two individuals belonging to the same group (buyers, sellers) to derive utility from each other. A second distinction comes from the utility gained by end-users which scales for platform products/service as the number of users “N” increases while that for an internet E-commerce site has a fixed upper bound.

2. Theoretically the maximum utility derived by an end-user from a platform based product/service is a function of N i.e. Utility = F (N * N-1), where “N” is the number of active users.

What makes Platforms based products and services different?

Platforms if done right confer on the pioneering firm the following advantages:

  • Lock-In due to Network Effects.
  • Monopoly / Winner-Take-All dynamics.
  • Perpetual Revenue streams.
  • Protection from imitators and price based competition.
  • Immunity against the need to innovate products faster.

Who can win the inherently risky and uncertain platform game?

Establishing a platform is an extremely risky venture where the outcome is uncertain. The odds are in favor of a firm that is:

  • Pioneer with first-mover advantage.
  • Revolutionary new idea (product / service)
  • Access to capital or with deep pockets.
  • Iron-clad patent protection.
  • Access to complementary assets.
  • Installed base and brand name.
  • Management skills to take decisive steps at each stage of the platform evolution.

Strategic Guide for developing Platform based products and services:

The strategic options available to firms considering a platform based approach to developing products and services are:

    1. Platform Strategy – Closed, Shared or Open
    2. Licensing Agreements
    3. Strategic Partnerships
    4. Subsidies
    5. In-House Complements
    6. Complement Providers
    7. Marketing Mix

1. Platform Strategy – Closed, Shared or Open:

The What: Platforms can be open, closed or shared.

  1. A platform is open if participation is unrestricted and free for one and all to join.
  2. A closed platform by definition is owned and controlled by one firm who decides among other things participation rights, platform features, partners and scope of complements.
  3. A shared platform is a joint effort by one or more firms bound together by common interests. Decisions on platform strategy are undertaken in the spirit of cooperation and commonly agreed upon goals.

The How: The decision to pursue Open, Closed or Shared platform strategy depends among other things on:

  • Barriers to Imitation
  • Possession of required complementary assets by sponsoring firm.
  • Installed base and leverage over industry participants.
  • Ability to fund big investments.
  • Availability of complementary providers with required expertise and know-how.
  • Coexistence of multiple platforms that can serve the same market profitably.
  • Cost of building the infrastructure and resources to deploy the platform.
  • Heterogeneous demands in customer needs and tastes that a single platform cannot serve.
  • Susceptibility of the platform to free rider problem.

The Risk: A closed platform allows a firm complete control and independence. However it requires a firm to have a breakthrough idea (product / service), ability to undertake large upfront investments in capital and resources and exercise leverage over other industry participants to build partnerships along the way. A shared platform in contrast allows firms to share the risk as well as rewards. Conflicts may arise with respect to platform roadmap, features, and resource allocation. In fast changing markets consensus among partners maybe slow to emerge jeopardizing the overall platform. An open platform is prone to free-rider problems, quality and control issues. Generating profits and revenue streams can be challenging with an open platform approach.

The When: A closed platform is the best way to enter the market initially when a firm wants to retain complete freedom over how the platform should evolve, who can participate, what features to offer and when. A closed platform may be a best option to recoup investments especially when a firm needs to commit large resources and undertake upfront investments. Once the platform acquires a large installed base opening the platform increases the overall value to all participants. A firm with a valuable intellectual property and fighting for acceptance within the industry may benefit from a shared approach by partnering with an industry heavyweight. When compatibility with an installed base is and winning acceptance from powerful complementors is critical a shared approach to platform development is the best way forward. An open platform serves mainly to dislodge deeply entrenched technology or in markets that are slow to take off and hence require government intervention.

2. Licensing (OEM) Agreements:

The Why: OEM Licensing can be a very potent weapon for the sponsoring firm to widen the installed base for a technology platform. An additional benefit of pursing this strategy is to co-opt competitors who posses resources to launch a superior competing technology. Licensing can be a very cost effective way of achieving wide scale market reach and penetration. Licensing also serves the purpose of ensuring that platform adopters don’t perceive the sponsoring firm as a monopolistic threat to their very existence. A firm may not have all the resources (tangible / intangible) necessary to serve all segments of the market.

The How: One way to go about achieving licensing deals is to establish a royalty fee based on unit shipments. For this to succeed the firm must have a unique offering protected by patents and perceived by others as synergistic to their core business. Another option is to actually pay adopters and complementors a portion of the revenues derived from transactions on the platform. The publicity that comes with a large number of OEM licensing deals sends a positive signal to would be adopters and complement providers of momentum behind a platform.

The Risk: A firm following this strategy should have patents that act as a barrier against imitation. Following this strategy is a sure shot recipe to value destruction in the long run if the technology behind the platform is the sole driver of revenue and value creation for the licensing firm. Competition will eventually drive down prices and erode market leadership unless the firm can innovate faster. The uncertainty surrounding platform adoption and market potential can pose challenges when structuring royalty payments.

The When: If the firm sponsoring the platform does not have a strong track record or a dominant position in the industry a licensing strategy makes perfect sense. Licensing is also important when a firm intends to establish its technology or platform as the dominant one in the industry. A firm must judiciously exercise this option at the very beginning so as to reap benefits later. However in doing so, the firm must have patents that prevent imitators for leapfrogging or have alternate sources of revenue that it can protect and sustain over a period of time.

3. Strategic Partnerships:

The Why: If launching a platform requires large upfront investments a partnership can minimize risks to both sides. A partnership is strategic and synergistic, when partners have a product portfolio and a revenue base that don’t overlap with minimal threat of encroachment. At the same time the partnership has to bring together complementary assets that each partner can leverage and deploy. Strategic partnerships can be employed as a preemptive move to diffuse powerful incumbents.

The How: One way to go about achieving strategic partnership is through cross-licensing of IP’s and patents and by establishing a royalty free licensing pool. Strategic partnerships can take the form of joint-venture, equity investments, platform co-development, joint marketing and/or sharing of complementary assets (technology, sales, distribution and manufacturing). When access to complementary assets is paramount revenue sharing can be a viable option.

The Risk: Strategic partnerships can be difficult to enforce, monitor and realize when firms have conflicting end goals. Power struggles and battles on platform evolution, roadmap and patent infringements can create challenges in developing a long term symbiotic relationship. Strategic partners may end up as formidable competitors later.

The When: If the firm sponsoring the platform cannot fund all the critical resources (capital, infrastructure and technology) and/or lacks complementary assets strategic partnerships are the way forward. Partnerships are a way for a firm to minimize risks and upfront investments in amassing all necessary complementary assets. Strategic partnerships can be very crucial when the success of a new platform depends on maintaining compatibility with an installed base or needs participation of powerful complement providers.

The main difference between Licensing Agreements and Strategic Partnership is, with the former you are proliferating the market with intent to preempt competition while the latter serves to address a shortcoming in your capability to create new markets through partnership.

4. Subsidies:

The Why: Buyers generally refrain from making upfront investments on products and services that are inherently risky or new. When the technology is still emerging it is unreasonable to expect platform users to pay a premium to adopt your product. One way to circumvent this problem is by way of subsidies that lower the price for would be adopters while recouping lost revenues through complementary services or products.

The How: To stir up a large installed base “Penetration Pricing” or “Freemium” can be the right strategy to deploy. In the extreme case where developing the platform incurs huge upfront costs (Ex: Gaming console, Personal computers, DVD players) an optimal strategy would be to subsidize platform users (higher price sensitivity segment) by pricing below cost while collecting a right-to-participate fee from platform providers and complement providers. A subsidy in the form of government rebate or tax breaks can also serve as a way to stimulate adoption but requires an open platform in most cases.

The Risk: Unless the platform sponsor (provider) has a superior technology, iron clad patent protection, deep pockets and an industry leader extracting subsidies from platform participants can be challenging. In the extreme case when complementors yield more power, the platform sponsor might be forced to settle for a smaller share of the revenues and focus on volume transactions. Care must be taken to prevent fee-riders or heavy users from abusing the platform.

The When: Subsidies are the right way to overcome resistance to adoption when the product (service) is revolutionary and requires platform participants and end users to make substantial investments or forgo sunk costs in legacy products. Subsidizes should only be offered when the platform sponsor has alternate means of recouping lost revenues in the form of platform participation or usage fee.

5. In-House Complements:

The Why: Platforms by definition suffer from a “Catch-22” or what is commonly referred to as “Chicken-and-Egg” problem. Potential platform participants (providers / complementors) will hesitate making a commitment until they are sure the investment will pay off. Likewise platform end-users will prefer to wait and watch before diving in.

In the absence of a large established user base attracting complementors whose participation is a must for end users to gain utility from the platform poses a significant challenge. Developing in-house complements become a necessity for the platform to have a life. In-house complements send a strong signal to would be platform participants that the sponsoring firm is committed behind the platform.

The How: To kick starting the self reinforcing positive feedback, the platform sponsor should be prepared to develop complements in-house at least during the initial phase. Development of in-house complements should commence early on so that the platform can be launched with complements. Bundling complements with the platform can be one approach to ensuring that the cost of developing In-House complements is recouped. In-house complements must start strong and build a stellar reputation and brand name where possible.

The Risk: Developing in house complements along with sponsoring a platform requires large investments and commitment from a firm’s management. A risk-averse firm and its manager will find it difficult to secure funding and resources when returns fail to cover the cost of capital. The problem is acute in publicly traded firms where management must withstand the scrutiny of share holders and investors alike.

The When: Developing in-house complements becomes a necessity when a platform is revolutionary, evolving and incurs irreversible sunk costs in resource and capital from external platform providers and complementors. Platforms with pioneering technology that require hand holding and a longer learning curve may also prompt a firm to develop complements in-house initially. Developing in-house complements also ensures that only high quality products reach the end users.

6. Platform Complementors:

The Why: Complements enhance the value of a product by conferring additional benefits and enriching the overall experience for the end user. Complements allow a firm to establish a virtual R&D factory without the need to fund the projects. A complement may be something tangible: add-on product or an intangible: service.

The How: Developing complements requires an ability to develop relationships with multiple players and participants from all sections of the industry. It requires foresight and an uncanny ability to lead, to seek, to nurture and to develop win-win relationships. The sponsoring firm might have to fund external complementors. It must facilitate complementors to develop a viable business model that can generate revenues from the platform. An independent business unit armed with personnel, money, power and authority along with the right incentives to act in the best interest of complement providers will ensure a better chance of success. Development of technology standards that facilitate easy integration and programs that allow advanced access to technology must be instituted. The platform sponsor can consider making minority investments, taking controlling stake or signing an exclusive contract with promising complement providers.

The Risk: Complement providers may not invest the resources, talent or time to develop value added services or products for the platform. Products may suffer from quality issues or fail to meet the needs of users. If left unmonitored an influx of me-too complementors could undermine the profitability of the entire ecosystem by driving down prices through competition and imitation.

The When: The firm’s business model should clearly define its scope with respect to the platform and those of its complementors. Building trust and partnership takes time and should be prioritized constantly. Evaluation of partners that augment and enhance the platform’s overall utility to the end-user must be accorded importance at each stage of the platform’s development. In the early stages of the platform evolution complement providers that the ability to attract new users should be given priority. In the later stages complement providers that enhance platform stickiness must be sought out. As the platform evolves complement providers that bring diverse products and services should be added to the platform mix.

7. Marketing Mix:

The Why: Effective use of the marketing mix – Product, Price, Promotion and Place can make all the difference when launching a new platform. A platform that fails to solve an unmet customer need with inadequate promotion and distribution reach may fail to attract a large user base. Pricing is all the more important when establishing a new standard or platform due to the risk-averse nature of most buyers.

The How: The product should offer a value proposition unmatched in the marketplace. Targeting lead adopters and securing endorsements from key opinion leaders can be extremely beneficial. A myopic pricing policy that aims to satisfy P&L statements will only deflate adoption rates. To stir adoption and establish a wide installed base the firm must chose penetration pricing; forgoing short-term profits over long-term benefits. The firm may have to blanket the market with a full product line to meets heterogeneous segments of the market. An expansive distribution reach must follow to ensure product availability and penetration within the market. The importance of effective advertising to ease concerns regarding ease of use, compatibility, reliability and value proposition should not be overlooked.

The Risk: The platform may fail to reach critical mass forcing the firm to write down millions of dollars in marketing and R&D investments. The flip side, wide spread adoption and subsequent demand may find the firm scrambling to meet excess capacity or fulfill user requirements without scaling infrastructure. Penetration pricing requires deep pockets and the ability to fund operations in the absence of credible revenue base.

The When: The firm should spend heavily on advertisements, joint promotions and media campaigns during launch of the platform. Price aggressively early on even if it means selling at or below cost. Distribution coverage should mirror the adoption profile targeting lead adopters initially before moving to the mass market. Product and service mix should emphasize the composition of the user base with an aim to serve all needs arising on the platform check here.

Acknowledgements:

I am deeply indebted to Professor Hemant Bhargava and Professor Greta Hsu at the UC Davis Graduate School of Management and Professor Siobhan O’Mahony now with Boston University School of Management for providing me a foundation and inspiring me to pursue my passion. Thank You !
New Product Design– A Toolkit for Identifying Whitespaces

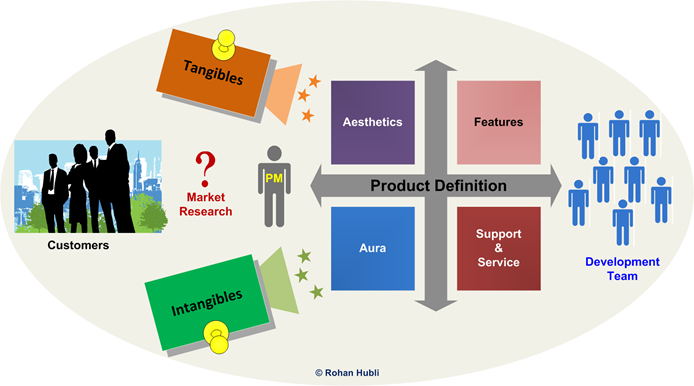
When developing new products it is the job of a Product Manager(PM) to use his judgment based on inputs from market research, competitive intelligence and development teams to come with a product-mix that offers customers a compelling reason to buy.

Product-TangiblevsIntangibles

Any offering by its very existence forms a unique triangular dependence with three major constituents:OfferingTriangle

  1. Customers
  2. Substitutes (Competition)
  3. Firm’s Offering

When conceiving new products the triangular relationship is of paramount importance. A new offering can either be similar or distinct from what’s available in the marketplace.

A savvy PM will instantly think of “Differentiating” his offering in order to attract buyers and gain a footing in the marketplace.

Why Differentiate an offering in the first place ?

Differentiation makes a product/service less sensitive to price based competition by limiting the buyers choice set on substitutes. 

Differentiation is a strategic weapon whereas Pricing can be both strategic and tactical. 

Is differentiation always good ?

Differentiation is a double edge sword in that while it allows a firm to generate higher margins it has the effect of restricting sales volume due to heterogeneity in customer traits. 

In many industries the breakdown on Customer Segments and Market Size based on Price and Quality dimensions shows remarkable similarity (Table below).


Price

High

Low

Quality

High

Premium / Luxury
( Market Size: 15% -20% ) 

Value / Mass Market
( Market Size: 50% -60% ) 


Low

Arbitrage / Opportunistic
( Market Size: 5% -10% ) 

Bottom Market
( Market Size: 10% -15% ) 

Source: Creating Strategic Leverage, Milind M. Lele

Assuming you have factored all of this in, and convinced that differentiation is the way to go then the question boils down to How do you differentiate ?

Diving into Differentiation:

Broadly speaking, a Firm and its Product Manager have two basic means for differentiating a product based on either “Tangible OR “In-Tangible attributes:

Tangible
Attributes

Intangible
Attributes

1. Features

1. Aura

2. Aesthetics

2. Service & Support

 
 A. Tangible Attributes

1. Features:

Are the primary vehicle used to deliver a benefit. Features are what a product manager and all constituents internal to a company focus on. For the end user or paying customer features matter very little if they don’t confer some benefit.

This is where most Product Managers commit fallacies that result from:

(a) Scoping products with rich feature sets that drive up cost without paying attention to what benefits they deliver or the benefits that customer care about.

(b) Casting products without anticipating current/future needs or misjudging close competitors and substitutes as the only viable choice set for consideration.

(c) Failure to position and map the product features into benefits for customers and stakeholders alike during marketing and sales pitch. 

2. Aesthetics:

Aesthetics govern the look and feel for a product or service. Its sole purpose sometimes is to engage customers visually to lure them and on rare occasions invoke feelings of pleasure each time the product is used.

Are Features and Aesthetic accorded equal weight by customers ?

Not always, for some product classes customers exhibit asymmetry when weighing between aesthetics and features. Most products sold to B2C customers fall in this category.

Example: Desktop-PC’s vs. Laptop’s

All else being equal a desktop computer, usually tucked under the table, might still attract buyers even when it has inferior aesthetics. On the other hand a laptop needs to be both feature rich and visually appealing for it to sell.

 B. In-Tangible Attributes

 1. Aura:

Aura defines the cognitive feelings and responses that a product or service invokes in the customer’s mind read this article. Branding and Advertisements play an important role in creating, communicating and conditioning the attitudes and behaviors on both the demand-side and supply side of the market place.

Aura confers status, establishes identity and reassures customers of their choices.

2. Service and Support:

Not all products carry service and support, in fact most buyers prefer not to deal with it. But invariably anything that is sold needs some amount of support in facilitating its procurement, installation, usage and consumption.

A pure Service Good on the other hand has no physical product that is sold but rather solves a problem or eliminates hurdles for the end customers. Services also include ecosystems that differentiate and augment the core offerings.

7 Rules of Product Acceptability:

A new product although differentiated may still fail to gain market acceptance   if the following rules of product acceptability are overlooked.

  1. Functional Performance
  2. Acquisition Cost
  3. Ease-of-Use
  4. Operating Cost
  5. Reliability
  6. Serviceability
  7. Compatibility

Identifying White Spaces: Tangible or In-Tangible Dimension

Now that we have explored the four possible dimensions to differentiate an offering in the marketplace, lets look at how to indentify whitespaces and to go after new opportunities.

When indentifying new market opportunities a strategist should neither exclude nor focus on solely one dimension. The only thing that should matter is whether there are enough customers who given the varied choices (offerings) before them prefer one combination over others.

Matrix of Whitespaces – New Opportunities

ProdutFeatureMatrix

The number of possible combinations using different mix of tangible (product features ) and in-tangible (service) attributes yields a matrix of 16 different cells each representing a unique offering in the market place. However not all offerings are relevant to all markets. Each offering in the matrix above shares a very unique and separate triangular relationship with its customers and substitutes.

The matrix offers firms and would be entrepreneurs a blue print to evaluate market opportunities and to formulate new product strategy. Implicit in the opportunity matrix above is the assumption that the returns exceed the cost of capital.

Whitespaces in EBook Reader Market

EbookReaders-WhiteSpace

Brocade & Foundry Networks: Behind the merger

The world is converging to Ethernet and IP. What happened to Telecom is now happening in the Data Center. Parallel infrastructures are costly to support, implement, operate, and maintain. Why have separate infrastructures for Storage (Fibre Channel) when you have an existing Ethernet infrastructure completely capable of supporting Storage networking?

Before Convergence                                                          After Convergence

 ConvergedDataCenter

While Cisco already has a Fibre Channel over Ethernet (FCoE) switch shipping today, the Cisco Nexus 5000, Brocade has nothing to offer and needs to play catch up. It takes tremendous amount of investment and R&D to bring an FCoE capable switch to the market.

The FCoE market opportunities for Brocade will be large and of high strategic importance. Early dominance of market share could expand to a long-term leadership position in the evolving SAN market.  This is possible because FCoE is clearly a disruptive technology, one that could change the underlying SAN infrastructure, business models, and, as a consequence, major players servicing and driving the industry.

Synergies:

Brocade is the leader in data storage networking in data centers with significant technology, product, distribution and installed base advantages.  Foundry is the leading innovator in data networking for enterprises and service providers, including performance leadership in the emerging 10GigE market.  With Brocade’s strengths in Fibre Channel technology and data storage and Foundry’s strengths in networking and Ethernet technology, Foundry is complementary to Brocade, not redundant. 

By combining, they will be a bigger, stronger company with additional diversification, technical IP, increased R&D and economies of scale.  They will be able to provide leadership across the breadth of the networking industry and their combined strengths will play to where the market is heading – highest performance and reliability, new and converged technologies.

Brocade and Foundry Networks: Product Synergies

The Brocade, Foundry Networks merger will allow the two companies to develop a Data Center switch capable of meeting the needs of a converged network and tackling Cisco’s emerging threat in the data center space.

Product Synergies

Table 1: Brocade and Foundry Networks Product Synergies

Brocade’s storage area network expertise can be leveraged against Ethernet based networking expertise from Foundry Networks to develop the next generation Data Center switch capable of competing against Cisco Systems.

Brocade and Foundry Networks: Channel Synergies

Brocade has fared quite well internationally while Foundry’s success has come from domestic sales, such as those to the federal government. Brocade has relied mainly on OEMs to move its gear while Foundry’s focus has been on direct sales and channel partners. From the marriage then comes a more rounded supplier.

Brocade and Foundry Networks: Cost Synergies

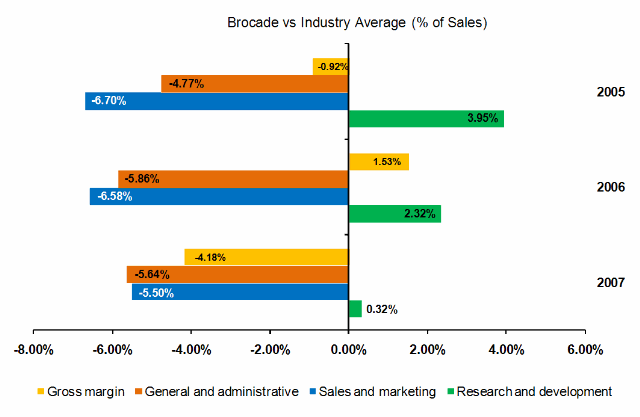
Brocade’s investment in R&D as percentage of sales has been declining year over year although its spending is still higher than the industry averages.  At the same time Brocade has seen rather steep erosion on its gross margins as a percentage of sales. Brocade will face challenges going forward as reduced R&D spending and declines in gross margins will seriously undermine its position to meet growth with its current portfolio of products. 

BrocadevsIndustryAverage

Figure 1: Brocade Spending vs. Industry Averages (% of Sales)

Foundry Networks enjoys a healthy gross margin on its sales, better than the industry average. The gross margins have remained steady and improving, a significant indication of Foundry’s successful product line. The high sales and marketing costs are an area that can be optimized.

FoundryNetworksvsIndustryAverage

Figure 2: Foundry Networks Spending vs. Industry Averages (% of Sales)

Brocade/Foundry Combined Strengths:

A merger between Foundry Networks and Brocade will allow both companies to realize economics of scale in Sales and Marketing costs. The combined entity will further boost Brocade’s revenues by offering end-to-end data networking and storage solutions.

Brocade’s storage area network expertise can be leveraged against Ethernet based networking expertise from Foundry Networks to develop the next generation Data Center switch capable of competing against Cisco Systems.

BrocadeandFoudry-CombinedStrength

Table 2: Brocade & Foundry Combined Strengths

References:
  1. Brocade 10-K SEC Filings for 2005-2007 
  2. Foundry Networks 10-K SEC Filings for 2005-2007
  3. 10-K SEC Filings 2005-2007 Major Players in the Networking Industry